
Earth’s climate is changing. It affects our weather, the oceans, ice, ecosystems, and society. Some of it is natural. But, humans are contributing to climate change in profound ways. Billions of tons of carbon dioxide (CO2) and other gases that trap heat are released into the atmosphere each year. These greenhouse gases are measured and monitored by several agencies. The level of CO2 is currently at 400 ppm (parts per million) and continues to rise.
This is not new information. It has been known for the past 50 years that Earth’s CO2 is trending upward. What is new is this particular number. It is going to be higher in the future. The issue should have been addressed by the global community in a comprehensive way back then and through the decades that followed to the present. My fear is that the story will get some news coverage for a few days, and then fade away like it has in the past.
The goals of this post are…
• to present some history of CO2 measurements done since the 1950s
• to show what those early measurements revealed about CO2 levels in the atmosphere
• to point out what the long-term record indicates about past and present change
• to present two interesting animations of the data
Keep going. I’m with you.
Early CO2 Measurements of the Atmosphere
In 1953, Charles David Keeling started his post doctoral studies at Caltech. He got involved in a project to measure CO2 extracted from air and water samples. In Pasadena, he found significant variations in the amounts of CO2 which he attributed to the releases from industry nearby. In order to obtain more reliable and consistent results and refine his techniques, he chose to sample the air away from the industrial sources. He started collecting samples from Big Sur near Monterey, CA. His samples showed less influence from industrial output. But, they also showed an interesting pattern. The day samples were yielding different amounts of CO2 than the night samples. It was a diurnal pattern of more CO2 at night than in the daytime. He was watching the Earth breathe. It stabilized at 310 ppm every afternoon. Repeated measurements on the Olympic Peninsula and the mountain forests of Arizona gave the same diurnal pattern and stabilization at 310 ppm each afternoon.
He explained his results in a book on meteorology. He believed these ‘free atmosphere’ measurements were typical of the atmosphere in the northern hemisphere. The night time measurements were influenced by the respiration of the local plants and soils. His work got the attention of scientists at the U.S. weather bureau and the Scripps Institution of Oceanography. Keeling proposed to the two organizations that infrared gas analyzers be used to measure the atmospheric CO2 concentration at several remote locations around the world. A South Pole station and Mauna Loa in Hawaii were included in the list of sites. During the International Geophysical Year (IGY) 1957-1958, his proposal was included.
Keeling directed the work at Mauna Loa starting in March 1958. The first CO2 measurement was 313 ppm. To his surprise, the CO2 concentration rose slightly until May, then decreased to a minimum in October. The pattern repeated again in 1959.
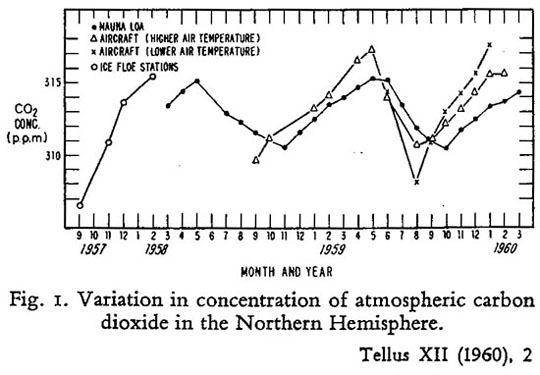
We were witnessing for the first time nature’s withdrawing CO2 from the air for plant growth during summer and returning it each succeeding winter.
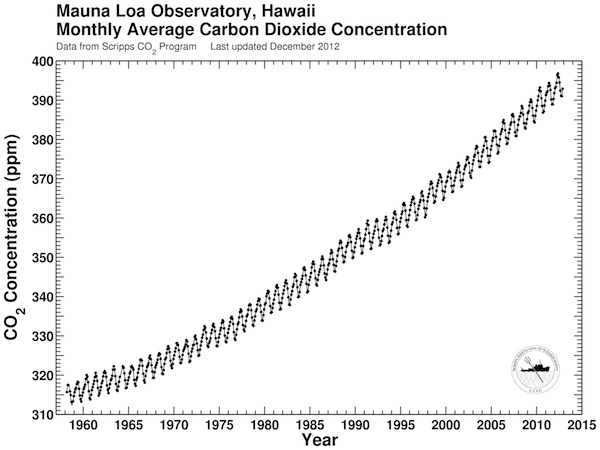
Dave Keeling directed the Mauna Loa program from 1958 to 2005 when he died. The program continues today. Earlier CO2 measurements used a wet chemical method and were inconsistent and less accurate. His air sampling technique using infrared gas analyzers and samples far from cities, forests, and other mitigating factors were very accurate. The seasonal cyclical variation shows up consistently in this graphic covering the 1958-2012 period. Individual monthly data points are included.
For comparison, five other data plots from northern and southern hemisphere sites are charted below. Each shows monthly average points in ppm reaching the current level of ~400 ppm. The evidence is clear. This is a global phenomenon.
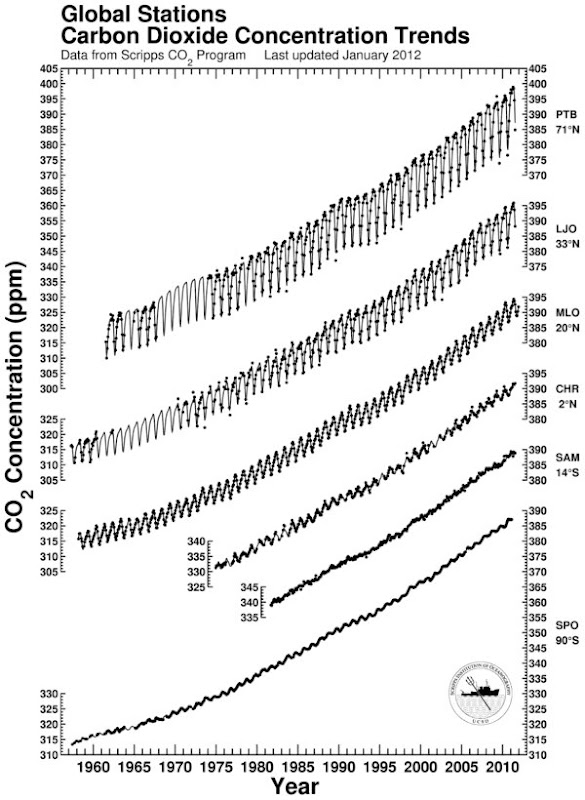
PTB-Pt. Barrow, LJO-La Jolla, MLO-Mauna Loa, CHR-Christmas Is., SAM-Samoa, SPO-S. Pole
Not only is the natural seasonal variation indicated from the growth and decay cycles of vegetation, there is also the very disturbing trend toward increasing concentration of CO2 assumed to be caused by the burning of fossil fuels by humans. Our impact upon the environment is obvious.
Vegetative and CO2 Cycles Animated Data
Part I
This recent NASA animation begins by briefly describing the role of CO2 in the environment and the factors affecting the concentration. Then, the Atmospheric Infrared Sounder (AIRS) instrument aboard the AQUA satellite is described. It monitors the CO2 levels world wide in the mid-atmosphere each day. It will show in orange in the animation. Vegetation in green in monitored by the Moderate Resolution Imaging Spectroradiometer (MODIS) satellite. Watch the seasonal changes taking place in both. Summer months increase vegetation and reduce CO2 levels.
Part II
The NOAA Earth Systems Research Laboratory – Global Monitoring Division published the following excellent comprehensive animation of the cyclical CO2 data. This animation is best viewed full screen. Stop and replay certain parts. It is loaded with information. Commentary of what to watch for follows. The animation starts January 1979 seen on a tan clock in the center. At left is a chart of plots from many global monitoring stations in the northern and southern hemispheres at a wide range of latitudes. A blue map plots their positions. At right is the Mauna Loa and South Pole data plot. Notice two things, seasonal cycles and the increasing trend of CO2 concentration. At the end of 2010, the chart changes to a different data set, presumably Mauna Loa, and extends back to 1958.
There is a pause in the animation followed by ice core data in orange from the Law ice dome in the Antarctic. The date moves back in time about 2000 years. That is followed by more ice core data. I provide two stills with comments below the animation.
This is a frame from the data of the Vostok ice cores in light blue. The dates labeled kyBCE stand for hundreds of thousands of years before current era. This ice core data record goes back 400,000 years.

This is a frame from about 400 to 800 kyBCE. This data is from the EPICA dome ice cores in the Antarctic. Around 400 kyBCE the two data sets overlap and coincide. These ice core samples put the CO2 concentration at 185 ppm 800 kyBCE.

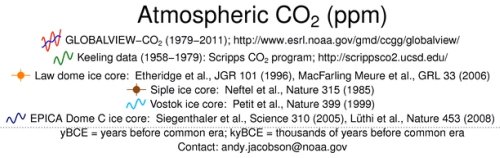
Here is the legend which is hard to see in the animation. I encourage watching several times in order to see all of the sequences clearly.
In Summary…
The Earth is a breathing entity, both daily and seasonally. It is obvious from the many charts showing the rise and fall of CO2 concentration. It isn’t a static planet. Over time monumental natural events have interrupted the balance and forced CO2 concentration to rise. Earth was resilient enough to cope with them. Since the industrial era, humans have caused changes that are not normal. Earth still breathes. But, it is more labored, in a sense. The changes over time are causing more extreme weather events, melting of ice, ocean rise, and climate changes.
To climate change deniers and skeptics, the information presented in this post won’t convince them of the need to act on behalf of the Earth and its people. To those of us who believe in science, this information reinforces what we have heard from many other sources. The Earth is in trouble. Humans have caused it. Humans can do something to correct it. We each have a role to play.
Thank you for reading … Jim
28 comments