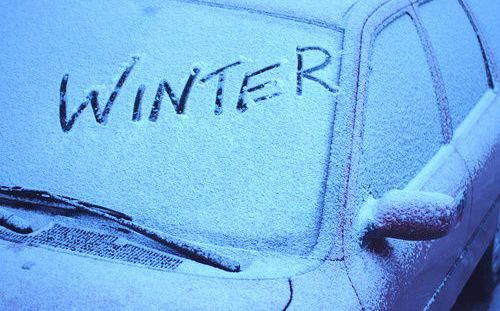
 Parts of the southeastern United States had a mild but nasty ice storm this past Friday. Ice storms in January in the southeastern United States are far from unheard of, but this one threw people for a spin because it was so cold that one would normally expect snow rather than rain.
One of the easiest things to forget for people who usually don’t track weather is that the atmosphere is alive and deep. In the United States, there’s usually between 7 or 8 miles of troposphere above you — the layer of the atmosphere in which the weather occurs. Subtle changes at any level within that layer means big differences in what kind of weather you’ll encounter at the surface.
First of all, we (Americans) have to keep in mind that we’re pretty much the black sheep of the world. Everyone on earth (save for Burma, one of the African nations, and stubborn oldies in Canada) uses the Metric system. They measure temperature in degrees Celsius, we measure it in degrees Fahrenheit.
For the purposes of weather forecasting, we have to use Celsius to keep things standardized. Just remember that…
-20°C = -4°F
-10°C = 14°F
0°C = 32°F (Freezing)
10°C = 50°F
20°C = 68°F
…and you’ll be okay for the rest of this post.
As you probably know, weather balloons are released at the same time all around the world twice a day. These balloons have radiosondes attached to them. They’re essentially little weather stations in a cardboard box that measure temperature, dew point, wind direction and speed, and sometimes a few other things between the surface and the time the balloon ruptures about a dozen or so miles above us.
This weather data is transmitted back to computers safely on the ground and plotted on something called a SKEW-T/LOG-P chart.
The name comes from the fact that the temperature (T) lines are skewed diagonally from bottom left to top right, and that the pressure (P) goes up logarithmically (log) on the chart.
Pressure isn’t consistent through the atmosphere. We measure air pressure in millibars — 1013.25 millibars is standard sea level pressure. Pressure goes down very quickly as you go higher in the atmosphere. Denver is at or around 850 millibars most of the time, for example, which is why you have such a hard time breathing if you’re not used to high altitudes.
10,000 feet off the surface is usually 500 millibars. 25-30,000 feet is usually between 200 and 300 millibars, where the jet stream is located.
When you draw these lines of constant pressure on a chart, the lines aren’t evenly spaced out. The higher you get in the atmosphere, the further apart the lines are spaced.

Since the pressure goes up logarithmically, the temperature lines get skewed at a 45° angle. I don’t remember precisely why, but I know that it makes it very easy for meteorologists to get a good idea of what the atmosphere looks like in order to forecast for things like severe weather (especially tornadoes) and winter storms.
Okay. Here’s a SKEW-T chart from Bufkit:

This one is a little bit different. Bufkit is a program developed by the NWS in Buffalo NY in order to help them forecast lake effect snow events.
Its charts are produced from model forecast data — NOT actual weather balloon data — so it allows us to look at what the models predict the atmosphere will look like for a specific point in the near future.
The only difference between charts generated by Bufkit and actual SKEW-T charts is that this one shows altitude instead of pressure. In other words, when you see a horizontal line on the chart, it’s telling you altitude in feet.
It makes it easy. Trust me.
Look back up at the black Bufkit chart I posted. It’s pretty easy to interpret once you know what you’re looking at.
Altitude is denoted by the horizontal gray dashed lines. The altitude corresponds with the number next to it, in thousands of feet. Thus, the “5” line denotes 5000 feet, “10” for 10000 feet, yada yada yada.
Temperature is shown by the blue and teal diagonal lines. The temperature corresponding to each line is in the brown area below. For instance, -30 would be -30°C. Remember that 0 is the freezing line.
The thick red line shows the temperature of the atmosphere. Put your finger on the thick red line at 5,000 feet, and drag your finger parallel to the blue/teal lines until you reach the brown surface. If you did it right, you should wind up around 3-4°C. That’s the temperature at 5,000 feet. The thick red line crosses the 0°C freezing line between 6000 and 7000 feet.
The thick green line is the dew point line. It works the same way as the thick red temperature line. The dew point, if you don’t know, is the temperature at which the the water vapor in the air will condense. Really low dew points indicate dry air. Really high dew points indicate very moist air.
When the thick green and red lines are far apart, that part of the atmosphere is dry.
When the thick green and red lines are close together, that part of the atmosphere is moist.
There’s a lot more I could discuss, but it’s irrelevant to the task at hand.
(PS: The barbs on the far right show the wind at different altitudes. The barbs show the direction from which the wind is blowing — a barb pointing to the left shows wind from the west — and the speeds are in knots.)
Glad you asked! We worry about 4 main precipitation types during the winter — rain, snow, sleet, and freezing rain.
Unless you live in the Atacama Desert, you know what rain and snow are.
Sleet is an ice pellet — essentially a rain drop that freezes solid before it hits the surface. It makes a loud tinging sound when it falls, and it’s a lot slipperier and harder to deal with than snow. It can also freeze solid after it falls, turning into a sort of glacial pack ice that’s impossible to remove once it solidifies.
Freezing rain consists of supercooled raindrops (water that falls below freezing, but doesn’t have any particles to latch onto to form ice) that freeze on contact with a sub-freezing surface. Yes, it literally freezes into a sheet of ice when it hits the surface.
The line between rain, snow, freezing rain, and sleet is razor thin, and is a huge pain in the ass for meteorologists to predict.
Remember that black SKEW-T chart I posted earlier? No? Hmph. I’m insulted. Well, here’s another one:

Look below 5,000 feet at the thick red temperature line. See how it’s well to the right of the teal 0° line? That indicates that the lower 5,000 feet of the atmosphere are well above freezing. Look right at the surface — it’s almost 10°C (50°F). There’s no way that anything frozen would be able to survive a warm layer like that.
That’s pretty much the story for any type of rain event in the winter. If there’s any deep layer well above freezing (4°C or higher for more than 1,000 feet), there will be complete melting and the precipitation will fall as rain.
Snow is almost the opposite, with some caveats of course. Here’s a SKEW-T chart showing a snowstorm:

The first stipulation is that there has to be moisture in the “snow growth region.” You see how there are two other teal temperature lines, between -20 and -10? Those two teal lines are -
9;8 and -12°C, respectively. This is the snow growth region. This range of temperatures provides the perfect environment for snow to form. If there’s moisture in this region, snow can form.
The next hurdle is that the entire atmosphere below the snow needs to be at or below freezing for the snowflake to survive. There can be a very small layer of temperature just barely above freezing, but for the most part it has to be all below freezing.
As you can see in the above chart, the entire atmosphere is moist and below freezing, indicating snow.
Sleet forms from partially melted snowflakes. When the snowflake falls through a shallow layer of temperatures above freezing, the snowflake partially melts. The result is a little ice crystal left inside of a raindrop. When this raindrop falls back into the freezing air, it’s able to freeze around the ice crystal, creating a little ice pellet.

As you can see on the above SKEW-T chart, the temperature goes slightly above freezing for a shallow layer of the atmosphere, allowing the snowflake to melt a bit, then reenter sub-freezing air and freeze into an ice pellet.
Freezing rain occurs when snowflakes completely melt into liquid, leaving no ice crystals left in the raindrop.
Here’s a freezing rain sounding:

You can see that the sounding stays above freezing for almost 5,000 feet, which is way longer than necessary for the snowflake to freeze. The raindrop is completely liquid by the time it reaches 500-1000 foot deep sub-freezing layer right above the surface. Once the droplet falls onto something on the surface, the sub-freezing temperatures freezes it to ice.
I showed you as close to a textbook version of each precip type as I could find. I had to search through 30 model soundings and scroll through 84 hours worth of forecasts for each to find a near-textbook example. This stuff isn’t always clear-cut, and just a small shift in winds can mean the difference between a cold rain and a prolonged ice storm, or the difference between 6 inches of snow and 3 inches of sleet.
This stuff is hard to forecast. When you’re under the gun for winter weather, please give your local meteorologists a break. All it takes is a few hundred feet to throw off a whole forecast and turn a winter wonderland into an icy deathmatch.
(Lovely note to end the post on, eh?)
47 comments