By: Inoljt, http://mypolitikal.com/
Presidential election results are often pictured through electoral college maps, a useful and simple tool. Looking at the competition of the two parties throughout time provides a quite interesting exercise. Certain states turn blue, then red, then blue again. Others stay the same color. One election the map is filled with red; the next election blue makes a comeback. And on and on it goes.
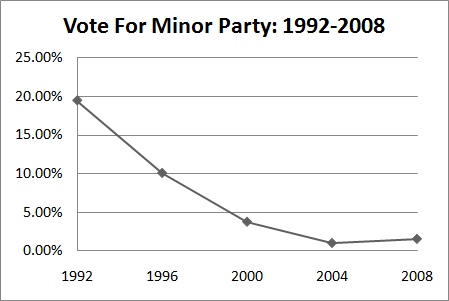
This is in fact quite deceiving. What the electoral college does not show is the history of third-party challenges to the two-party system. In 1992, for instance, presidential candidate Ross Perot finished with 18.9% of the vote – yet not a single state in the 1992 electoral college showed his third-party run.
Since 1992, however, third-parties have had quite a rough run. This graph shows the third-party vote after that year:
More below.
