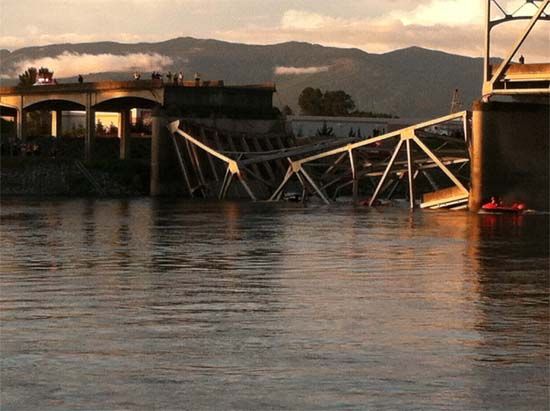
Bad news Friday May 24 about this bridge collapse. This from the New York Times.
MOUNT VERNON, Wash. – The partial collapse here on Thursday night of a heavily used river bridge on Interstate 5 caused no deaths, but as the long holiday weekend began it underscored the vulnerability of a transportation system that hinges not just on high-profile water crossings and tunnels, but on thousands of ordinary and unremarked components that travelers mostly take for granted.
A 160-foot section of the 58-year-old four-lane steel truss bridge, which crosses the Skagit River about an hour north of Seattle, crumpled around 7 p.m., apparently after being struck by a truck carrying an oversize load, state officials said. Three people were injured, none of them seriously, when vehicles went into the river.
I live in Iowa. It is mostly a rural state. We have nearly 25,000 bridges spanning at least 20 feet that carry highway traffic. Their average age is 42 years. Nearly 22% are rated structurally deficient by the Federal Highway Administration’s (FHWA) 2010 National Bridge Inventory (NBI).
NBI data is released annually and provides a significant level of detail on the condition of over 700,000 bridges nationwide. Bridges are inspected every two years, unless they’re in “very good” condition (four years) or “structurally deficient” (every year.) This data was released in February 2011.
Click on this map to view the linked online version. There, you can click on your state and see the statistics such as these for Iowa. I find the data disturbing.

Despite billions of dollars in annual federal, state and local funds directed toward the maintenance of existing bridges, 68,842 bridges – 11.5 percent of total highway bridges in the U.S. – are classified as “structurally deficient,” requiring significant maintenance, rehabilitation or replacement as of the publication of this report.
Tell me more…
You can also get a look at the individual bridges within a 10 mile radius of your location using this linked picture below. The map relies on the latitude and longitude provided by states. Inaccurate coordinates may be present. Many bridges may not appear in the proper location. While geolocation data (coordinates on the map) may be wrong, the information in the right hand box is generally reliable when you have clicked on a bridge near the entered location.

Presentation of the Data
Data from the NBI report has been compiled into these interactives by the organization Transportation for America. They decribe themselves as…
A broad coalition of housing, business, environmental, public health, transportation, equitable development, and other organizations. We’re all seeking to align our national, state, and local transportation policies with an array of issues like economic opportunity, climate change, energy security, health, housing and community development.
They stress that our national transportation policy has barely changed since the 1950s. Today, is a very different world. The interstates have been built. Americans are paying higher gas prices. People are plagued with costly commutes and congestion. Bridges are crumbling. Population is more urban. We are breathing dirty air. Our climate is threatened. Many older, younger and rural Americans are stranded with antiquated, unsafe, and inadequate transportation. Transportation for America offers a set of objectives and targets for the future.

Here is the link to their statement on the T4 America website blog of May 24, 2013.
Long range planning for the improvements to our bridges calls for a comprehensive approach. The problem of our crumbling infrastructure will not go away. We have already had one major disaster with the collapse of the I-35 bridge in Minneapolis in 2007. There were 4 dead, 79 injured, and 20 missing in the immediate aftermath. The cuts to funding, the sequester, shortages in state and county budgets, reduced revenues have all produced a worse outlook for our national and local infrastructure of highways. They aren’t the entire picture. Below many of our roads and bridges lies decades old water and sewer lines. These things don’t last forever and they don’t fix themselves.
What Can You Do?
Take a few moments to explore the interactive map of your state linked at the top of this diary. Click on it. Click on your state. Get a sense of how your state is dealing with bridge safety and maintenance. Click on the linked image below the break comment. Enter your home town. See where the reported bridges are within a 10 mile radius. Are you driving over any of these structurally deficient bridges?
Take time to contact your national, state, and local elected officials. Let them know how you feel about the importance of having safe bridges in your community. Let them know if you think this issue deserves a longer term and more comprehensive approach in the future. Ask them who they expect to fix the problems. Are they passing the problem along to our children and grandchildren?
Thank you for reading…JAR

41 comments