By: Inoljt, http://mypolitikal.com/
Presidential election results are often pictured through electoral college maps, a useful and simple tool. Looking at the competition of the two parties throughout time provides a quite interesting exercise. Certain states turn blue, then red, then blue again. Others stay the same color. One election the map is filled with red; the next election blue makes a comeback. And on and on it goes.
This is in fact quite deceiving. What the electoral college does not show is the history of third-party challenges to the two-party system. In 1992, for instance, presidential candidate Ross Perot finished with 18.9% of the vote – yet not a single state in the 1992 electoral college showed his third-party run.
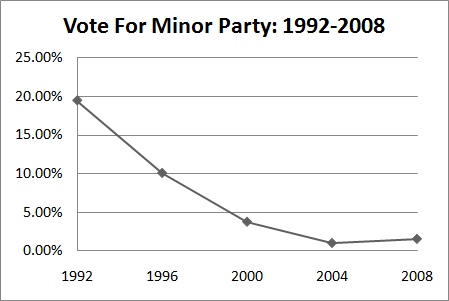
Since 1992, however, third-parties have had quite a rough run. This graph shows the third-party vote after that year:
More below.
Several factors influenced this. Mr. Perot ran again in 1996, winning a much reduced share of the vote. In 2000 Green candidate Ralph Nader polled as high as six percent, before his support collapsed as voters abandoned Mr. Nader for Vice President Al Gore. Then came the infamous Florida debacle, in which Nader votes literally cost the Democratic Party the presidency. Ever since then not a single third-party candidate has gained more than one percent of the vote.
Will either 2012 or 2016 be the year for a third-party run? On a micro-level, discontent with both parties does not appear to be extremely high. Democrats are fairly happy with President Barack Obama. The tea-party movement is really just a large group of amped-up Republican supporters – so the Republican Party isn’t exactly falling apart, either. Of course, these types of evaluations are naturally subjective. Different people may come to different conclusions.
Let’s take a look, then, at the macro-level trend. Here is a graph of third-party performance throughout the entire history of the United States, since popular voting first started.
The data here is also fairly inconclusive. Strong minor party candidacies seem to come and go in no particular order. There are long periods where they get less than 1% of the vote, and times where they regularly break the 10% barrier. To be frank, I was expecting to find a more discernible pattern – say, a strong minor party performance every four or five cycles.
Here is the data in a table format, for those interested:
To conclude, one can make a strong case either way. Since 1964, strong third-party performances seem to come every three elections or so. Under this argument, America might be overdue for a third-party candidacy in 2012 or 2016. On the other hand, one might also argue that the country is headed towards another long period of utter two-party dominance, such as existed from 1928 to 1964 (during the time of the so-called New Deal coalition).
What is fairly certain is that third-party candidates will continue having extreme difficulty actually winning the presidency. Out of 56 presidential elections, minor parties have a batting average of exactly zero. The strength and organizational depth of the two major parties, combined with the extreme hurdles presented by the first-past-the-post system, continue to make a third-party presidency almost impossible.
This might be a good thing. To date, the strongest minor party performance in the electoral college occurred in 1860, when they won a combined 111 out of 303 electoral votes. That year Republican candidate Abraham Lincoln won the presidency, despite not being on the ballot in ten states. Shortly afterwards the country plunged into Civil War.


5 comments